High-resolution CFD simulation in the internal carotid artery#
For this tutorial we consider an internal carotid artery model from the public dataset Aneurisk, and have used the first model; case C0001.
Meshing with a constant edge length#
We start the tutorial by performing pre-processing using a constant edge length, resulting in a constant density mesh.
This is performed by supplying the -m constant flag, and the -el N flag, where the latter determines the uniform
edge length in N millimeters (mm), controlling the coarseness or fineness of the mesh. To generate a volumetric mesh
with an edge length of 0.3 mm, run the following command after downloading the C0001 case:
$ vampy-mesh -m constant -el 0.3 -i C0001/model.vtp -bl False
Note that we have also applied the -bl False, meaning we do not add boundary layers to the model. For this particular
model, adding boundary layers would have required a smaller edge length because of the tiny arteries that the model
harbours. The resulting volumetric mesh is shown in Fig. 12, with a zoomed in view on the aneurysm.
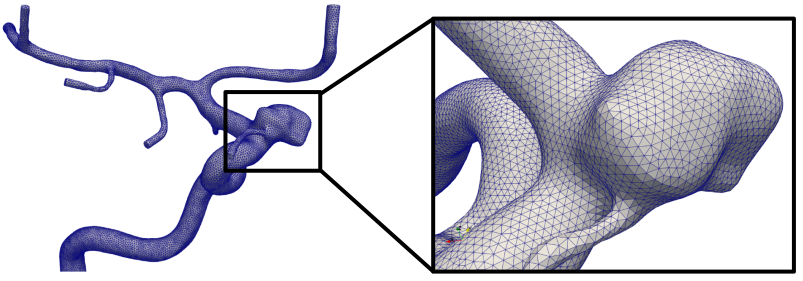
Fig. 12 A constant density mesh, with a zoomed in view of the aneurysm. Note that all tetrahedral cells are of equal size.#
Meshing based on the surface curvature#
A more rigorous approach is to mesh the vascular model based on its surface curvature, which can be beneficial to use
for models which harbour many regions of high curvature. An example of such models are complex geometries such as
aneurysms or carotid siphons, where it is recommended to have a denser mesh in the vicinity of the complex morphology.
Meshing based on the surface curvature is performed by supplying the -m curvature flag, and optionally the
--coarsening-factor flag, or -c for short. The --coarsening-factor
flag determines the coarseness or fineness of the mesh, where values > 1.0 will coarsen the mesh, and vice versa, with
a default value of 1.0. To generate a variable density mesh based on the surface curvature, run the following command:
$ vampy-mesh -m curvature -c 1.2 -i C0001/model.vtp
The resulting volumetric mesh is shown in Fig. 13, with a zoomed in view on the aneurysm.
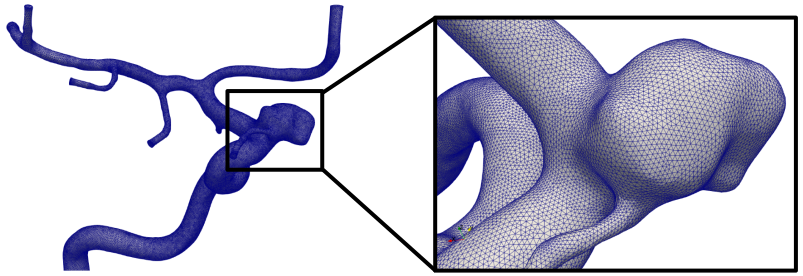
Fig. 13 A variable density mesh based on the surface curvature, with a zoomed in view of the aneurysm. Note that the mesh is refined along the tiny, high-curvature artery, and coarser along the larger parent artery.#
Meshing based on the centerline diameter#
As an alternative to the curvature method, as explained above, meshing based on the centerline diameter can be practical in tubular structures such as arteries. To get an intuition for what is meant by centerline diameter, we are in fact describing the diameter of a maximally inscribed sphere along the centerline located inside the object. This means that for tiny arteries, the diameter will be small, and vice versa for larger arteries, as shown in Fig. 14. Consequently, the mesh will be finer within tiny arteries, and coarser in larger arteries.
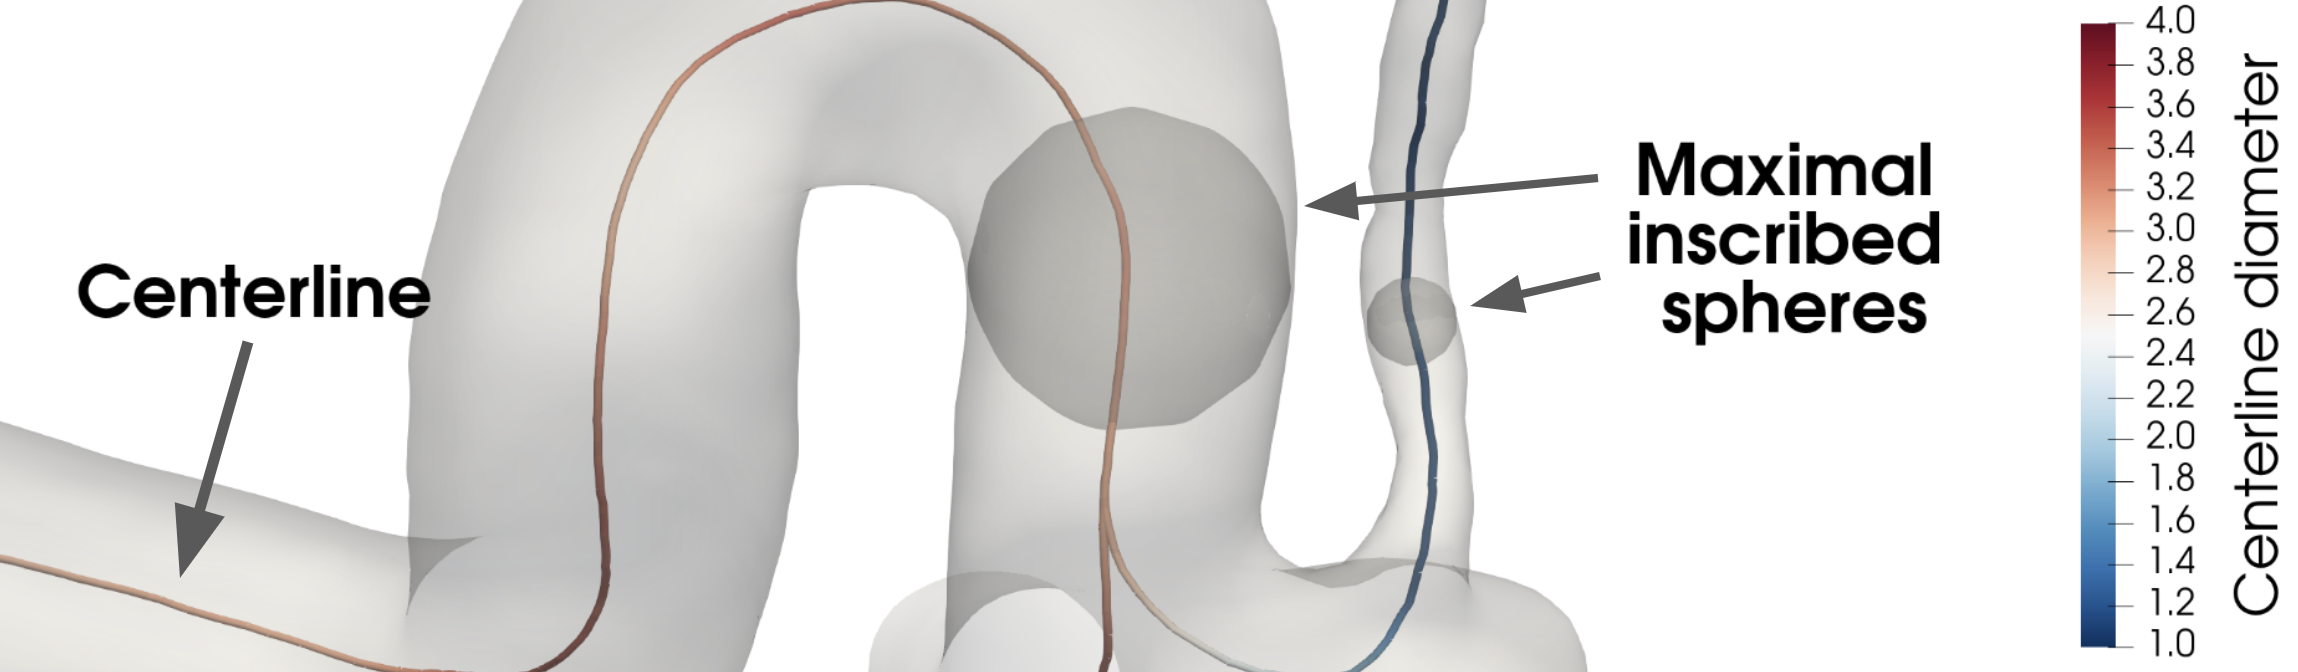
Fig. 14 The centerline inside the surface model, colored by it’s maximum inscribed sphere diameter.#
Meshing based on the centerline diameter is performed by supplying the -m diameter flag, and optionally
the --coarsening-factor flag, as above. To generate a variable density mesh based on the centerline diameter, run the
following command:
$ vampy-mesh -m diameter -c 1.2 -i C0001/model.vtp
The resulting volumetric mesh is shown in Fig. 15, with a zoomed in view on the aneurysm.
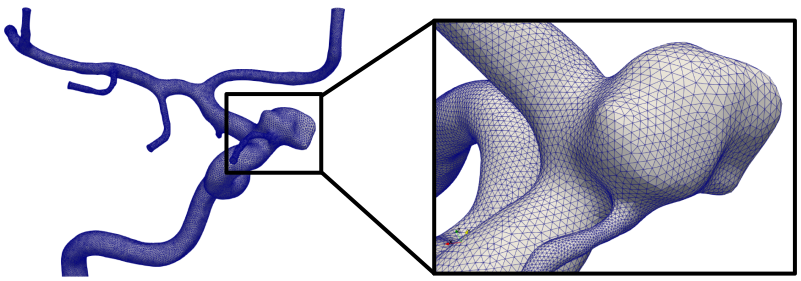
Fig. 15 A variable density mesh based on the centerline diameter , with a zoomed in view of the aneurysm. Note the difference in refinement between tiny and large arteries.#
It should be noted that because the aneurysm in itself does not harbour any centerline, it becomes coarse. However, this is something we will investigate in Tutorial 2, where we will refine a pre-defined regions of the geometry.
High-resolution simulation of the ICA#
In the concluding part of this tutorial we will generate a high-resolution volumetric mesh of the ICA, perform CFD simulation, and present the hemodynamic forces based on the results. For simplicity, we chose to mesh the artery model using a constant density mesh using the following command:
$ vampy-mesh -m constant -el 0.1 -i C0001/model.vtp
Running the command results in a volumetric mesh consisting of ~20M tetrahedral cells, as shown in Fig. 16.
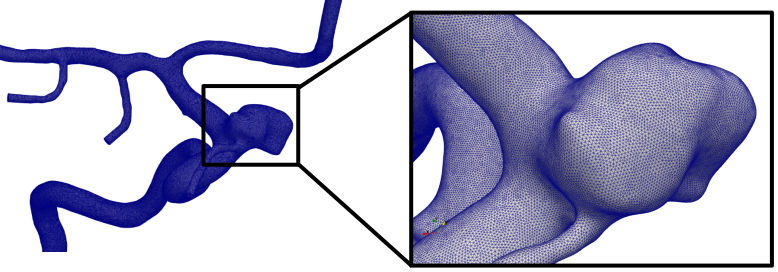
Fig. 16 A constant density mesh consisting of approximately 20M tetrahedral cells, with a zoomed in view of the aneurysm.#
The mesh is used as input to the CFD simulations, followed by computation of the hemodynamic indices, which is initiated as described here. The simulation was run for one cardiac cycle, corresponding to 0.951 s, with \(\Delta t =\) 0.0951 ms resulting in a total of 10 000 time steps per cycle. In Fig. 17 we present the volumetric rendering of velocity, the pressure field, the Q-criterion displaying vortical structures, and three hemodynamic indices; the time averaged wall shear stress (TAWSS), the oscillatory shear index (OSI), and the relative residence time (RRT).
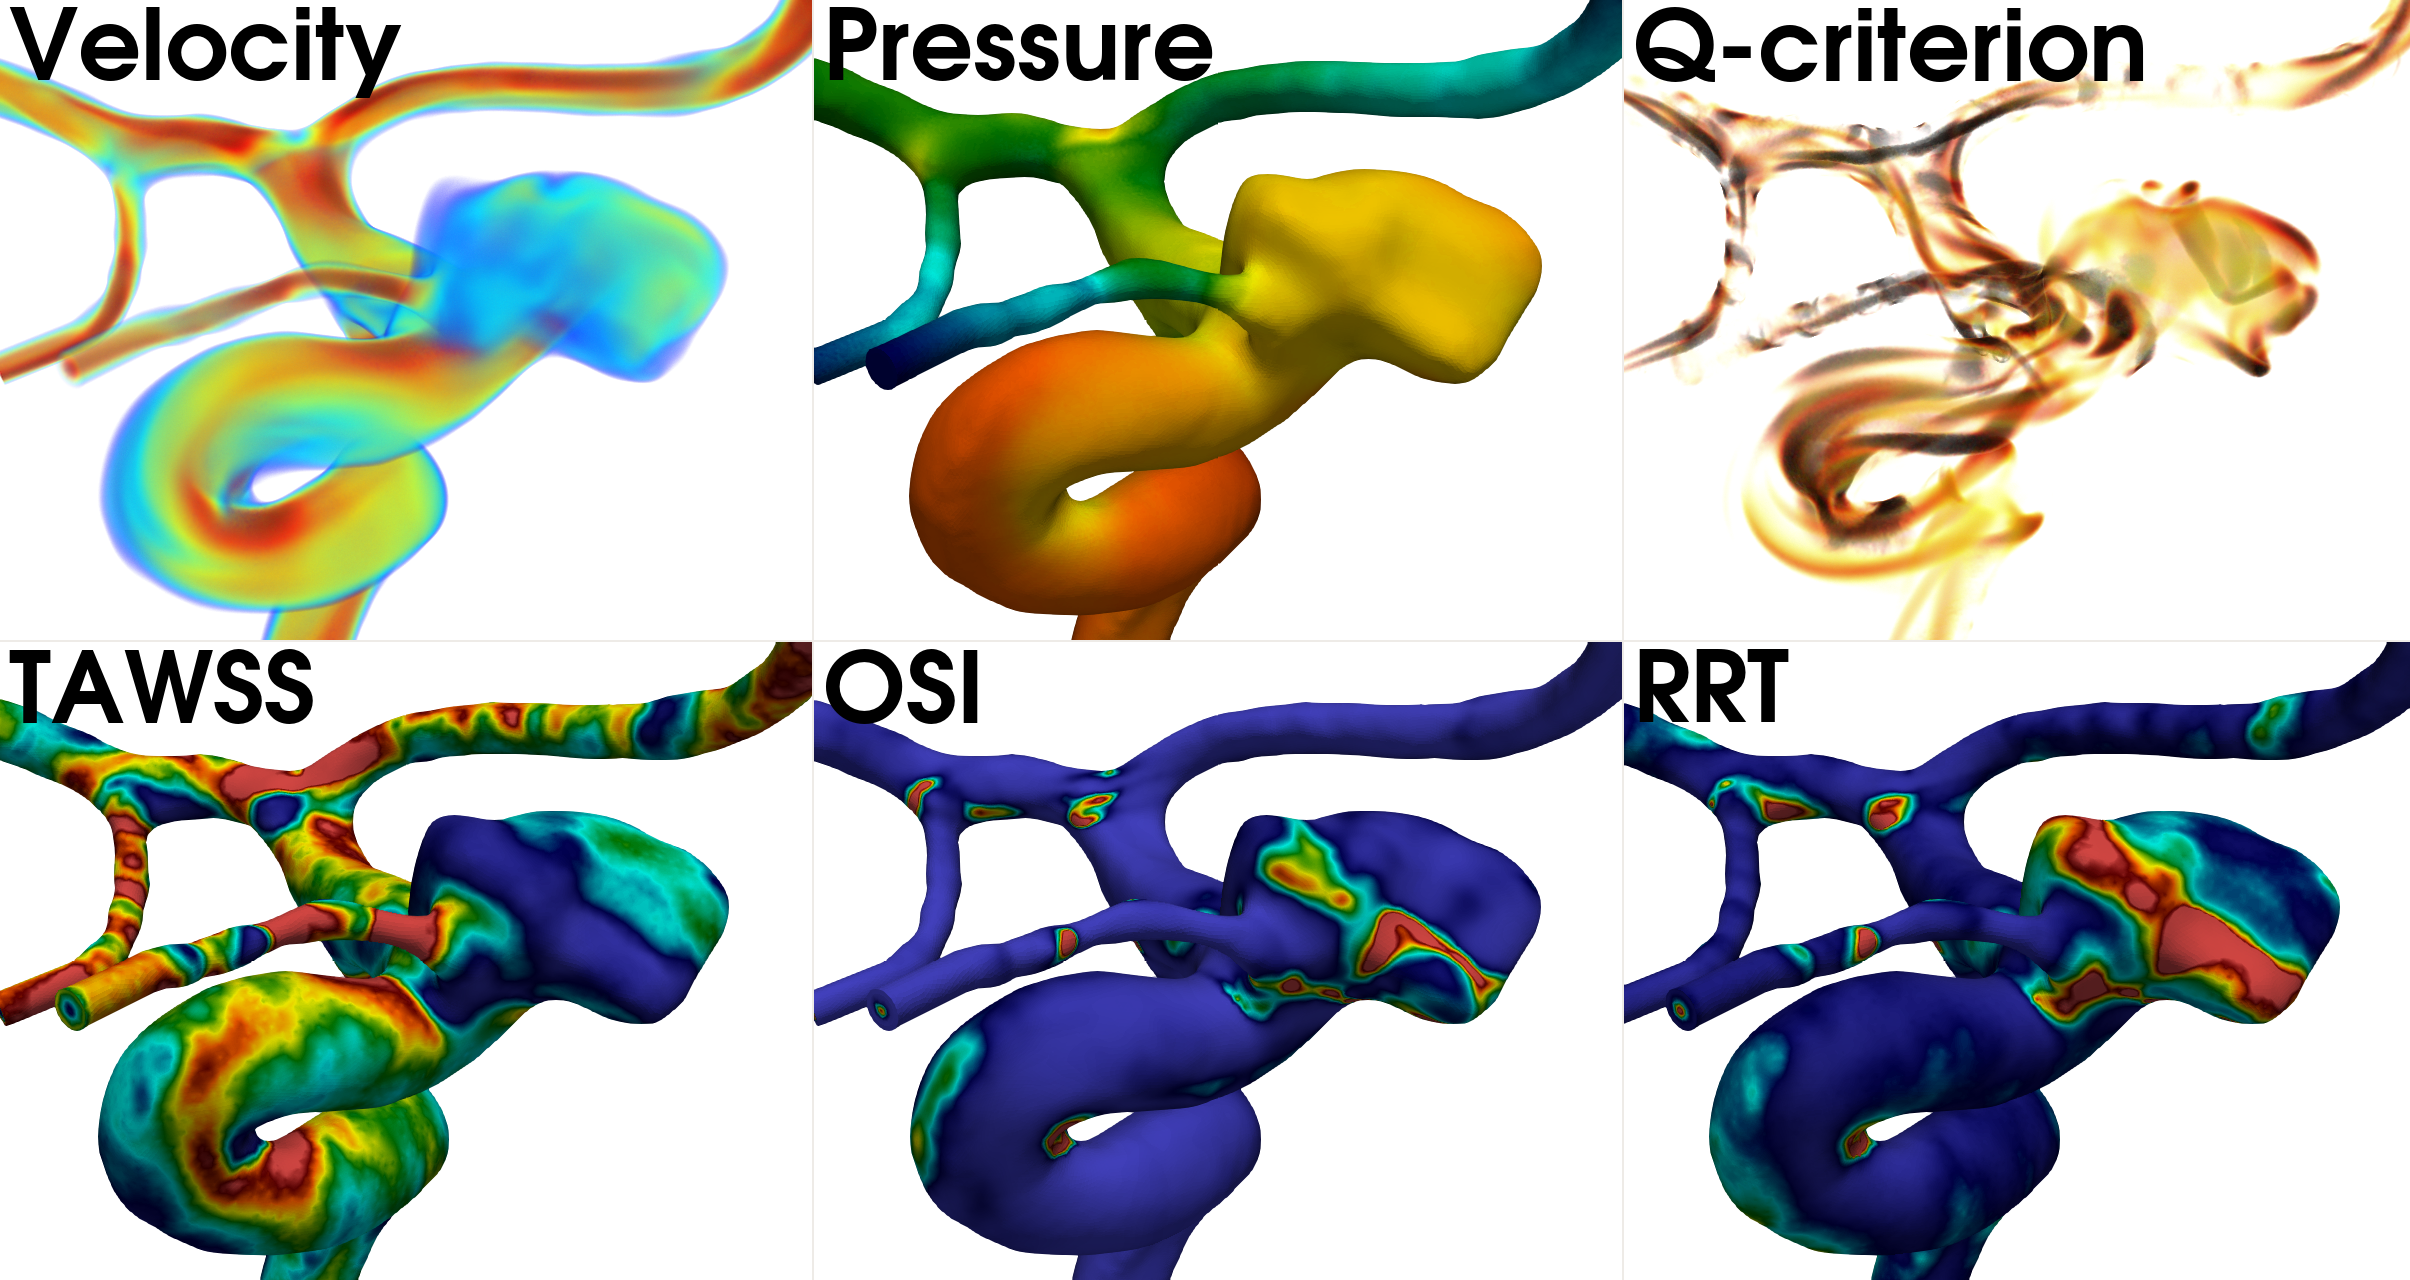
Fig. 17 From left to right: the volumetric rendering of velocity, the pressure field, volumetric rendering of the Q-criterion, TAWSS, OSI, and RRT.#