Hemodynamic simulation in the left atrium and left atrial appendage#
The second tutorial focuses on a left atrium geometry, collected from a published public dataset by Roney et
al.[RBP+21], located
here. In particular, we selected the endocardium model
labeled LA_Endo_5.vtk in the dataset, representing the inner left atrium wall. The tutorial is meant to demonstrate
that VaMPy is also applicable to other vascular domains, not only tubular structures.
Attention
Because VaMPy relies on vtkPolyData as input, the .vtk model needs
to be converted to .vtp (or .stl) format, which can easily be performed in ParaView
by using the Extract Surface filter, and saving the data as LA_Endo_5.vtp.
Meshing an atrium with appendage refinement#
The morphology of the left atrium is shown in Fig. 18, and typically includes an average of four pulmonary veins leading to a large chamber where blood circulates during the atrial diastole, before being pumped through the mitral valve into the left ventricle during atrial systole. In addition, on the left side of the chamber, the left atrium harbours the left atrial appendage, a small pouch-like extension of the atrium and known to be the most prone site of blood clot formation. Hence, this region of the left atrium is of interest, similar to intracranial aneurysms as presented earlier for the artery case.

Fig. 18 The surface model considered in this tutorial, where we have pointed out two of the four pulmonary veins, the left atrial appendage, and the mitral valve.#
To ensure that the hemodynamics are captured sufficiently inside the left atrial appendage, we will perform mesh
generation with refinement of this particular region. To manually refine a region on the geometry, the user may provide
the --refine-region flag, or
-r for short. Thus, to include a user-defined area of refinement, run the following command:
$ vampy-mesh -m constant -i LA_Endo/5/LA_Endo_5.vtp -r True -el 1.5 -bl False -fli 1 -flo 3 -at
Here, the -fli and -flo flags determine the length of the flow extensions at the inlets and outlet, respectively,
and the -at flag is used to notify the pipeline that an atrium model is being meshed. By executing the command above,
the mesh generation becomes
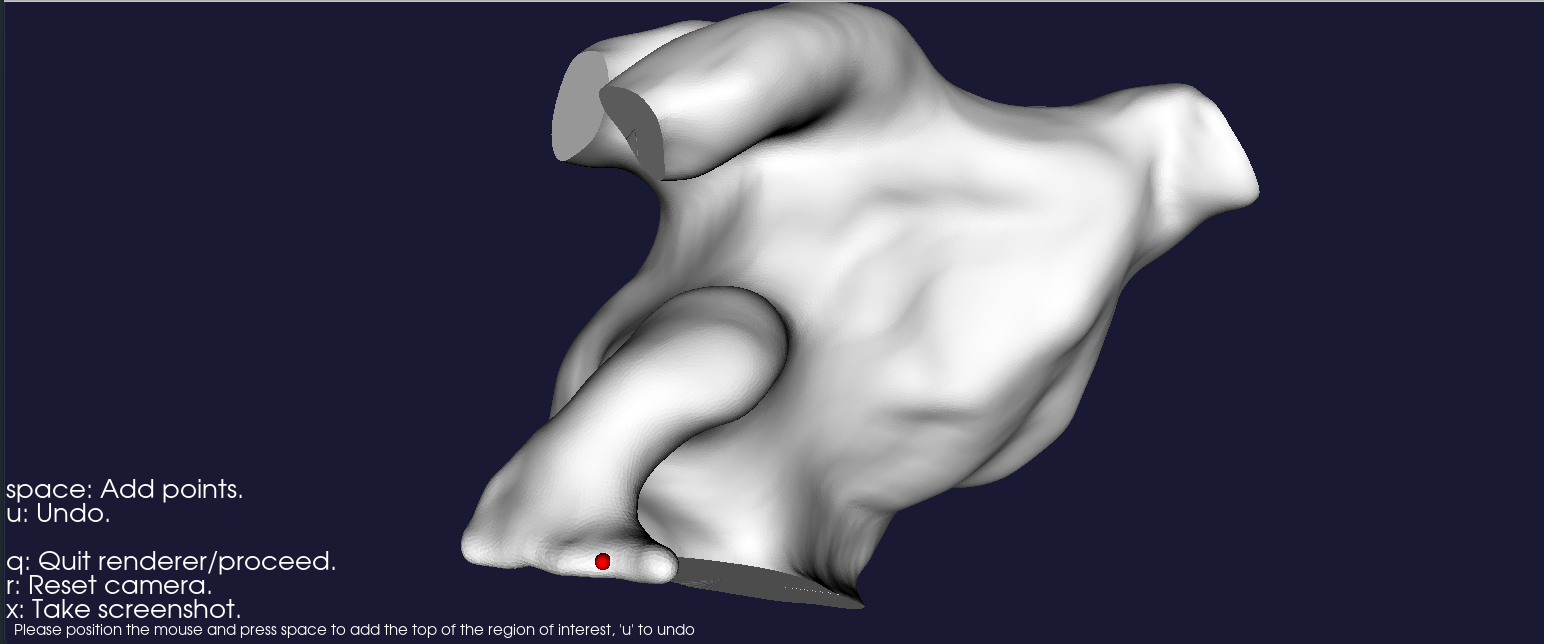
semi-automated, and a render window will eventually pop up, asking the user to specify a point on the surface that
will represent the region that will be refined, as shown in Figure 7. Navigate with the mouse, and press space to
place a point, u to undo, and q to proceed. The rest of the meshing pipeline is automated. Alternatively, the user
may supply the --region-points (-rp for short), followed by three numbers representing the \(x, y\), and \(z\)
coordinates of the point, making the pipeline fully
automated again. If the point is located slightly off the surface, it will stick to the closest surface point. For the
point shown in Fig. 19, this would correspond to running the following command:
$ vampy-mesh -m constant -i LA_Endo/5/LA_Endo_5.vtp -r True -rp 29.8 28.7 66.5 -el 1.5 -bl False -fli 1 -flo 3 -at

Fig. 19 Render window for placing a seed, defining which region of the geometry that will be refined.#
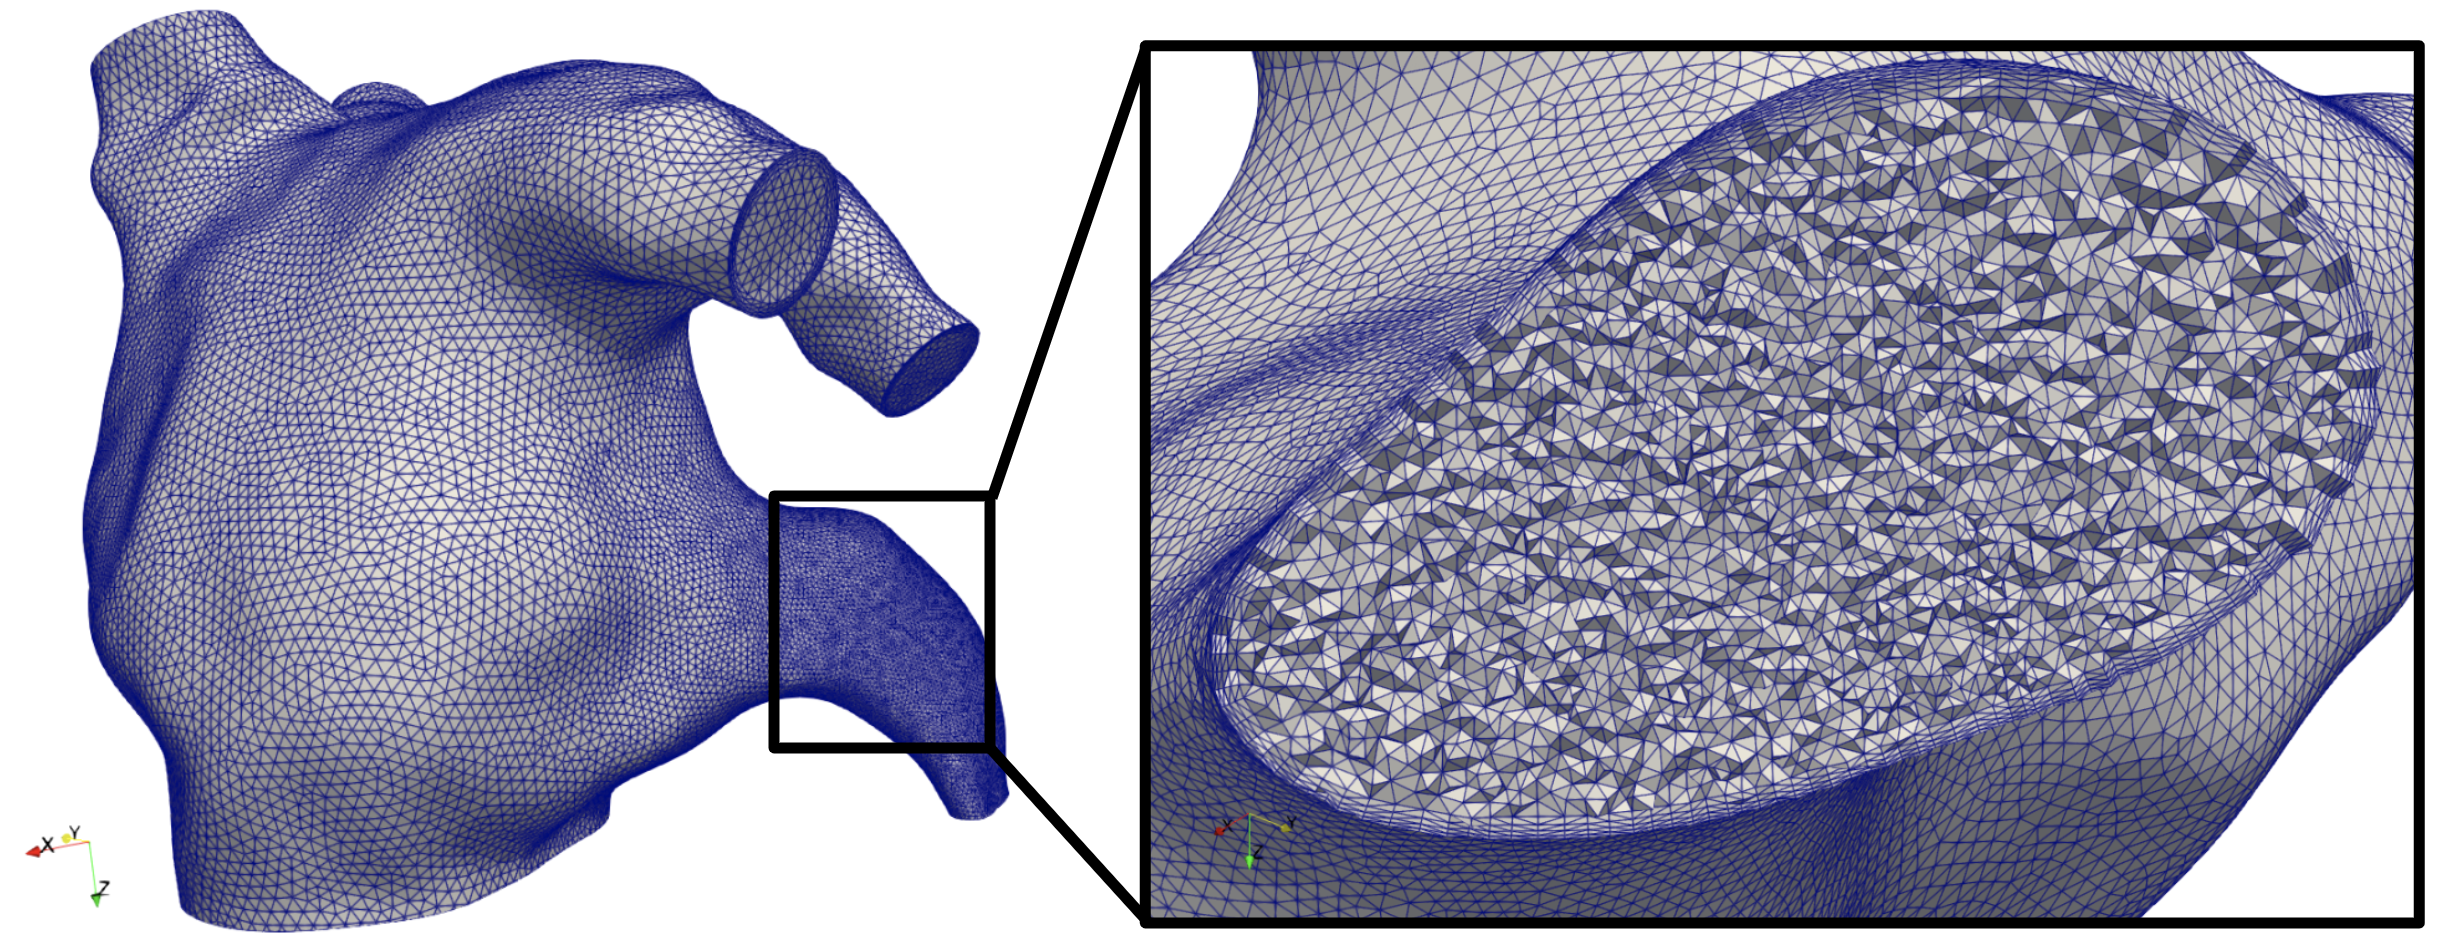
Using the command above should result in a volumetric mesh consisting of ~3.1M tetrahedral cells, as shown in Fig. 20 displaying the refinement in the left atrial appendage, and four boundary layers.

Fig. 20 Volumetric mesh of the left atrium model, with a zoomed in view of the left atrial appendage, clipped to display the refinement and four boundary layers.#
CFD simulation in the left atrium model#
The resulting mesh from the previous section is now used as input to the CFD simulation, followed by computation of the
hemodynamic indices. The only real difference from the artery problem from eariler is that instead of running
the Artery.py problem file, we here will be solving the problem defined in Atrium.py, also located in
the simulation
folder. Thus, running a left atrial CFD simulation can be performed by navigating to the src/vampy/simulation folder
and executing the following command:
$ oasis NSfracStep problem=Atrium mesh_path=../../../LA_Endo/5/LA_5_Endo.xml.gz T=951 dt=0.951 save_solution_after_cycle=0
Running the simulations will create the result folder results_atrium, with the results and corresponding mesh saved
compactly in HDF5 format. For this demonstration, the simulation was run for one cardiac cycle, corresponding to 0.951
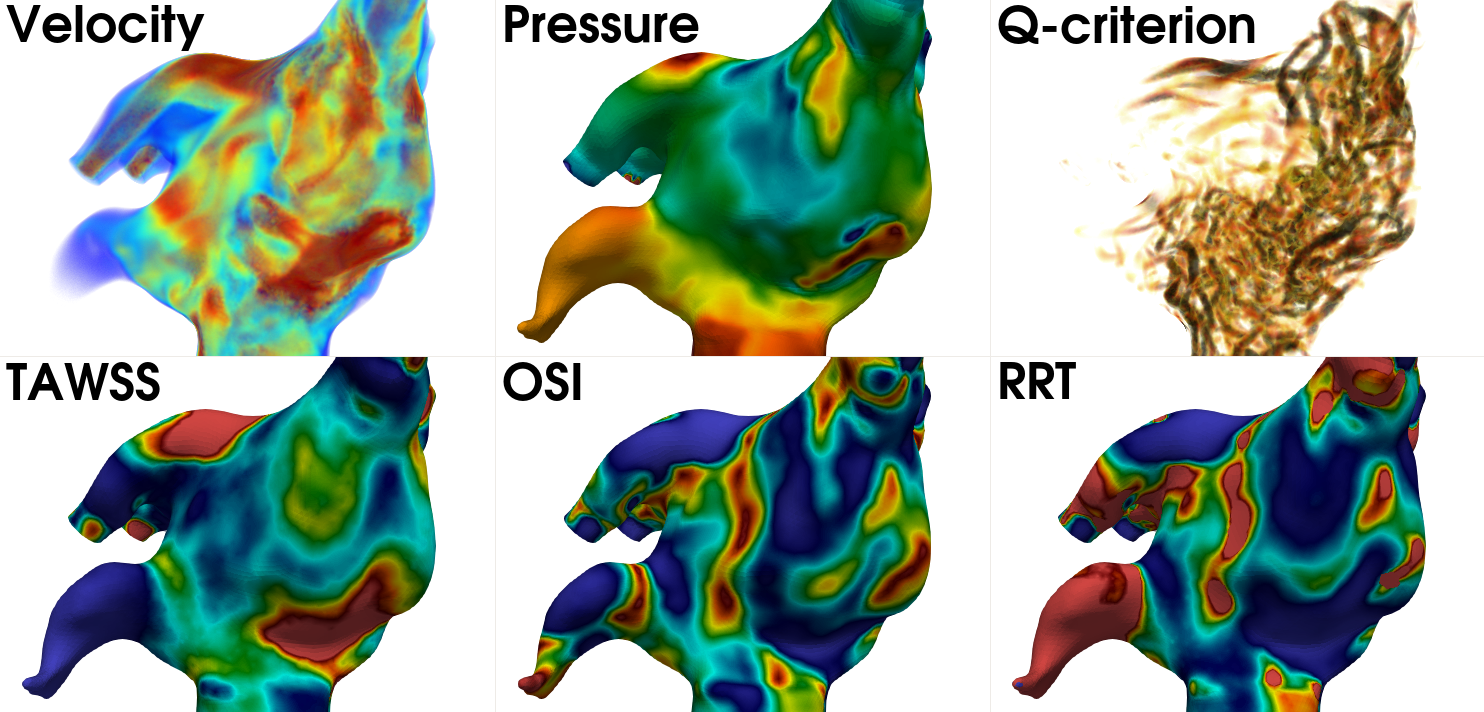
s, with \(\Delta t =\) 0.951 ms resulting in a total of 1000 time steps per cycle. In Fig. 21 we present the
volumetric rendering of velocity, the pressure field, the Q-criterion displaying vortical structures, and three
hemodynamic indices; the time averaged wall shear stress (TAWSS), the oscillatory shear index (OSI), and the relative
residence time (RRT).

Fig. 21 From left to right: the volumetric rendering of velocity, the pressure field, volumetric rendering of the Q-criterion, TAWSS, OSI, and RRT.#
- RBP+21
Caroline H Roney, Rokas Bendikas, Farhad Pashakhanloo, Cesare Corrado, Edward J Vigmond, Elliot R McVeigh, Natalia A Trayanova, and Steven A Niederer. Constructing a human atrial fibre atlas. Annals of biomedical engineering, 49(1):233–250, 2021.
